Logs
The agent on each server tails your apps’ logs and ships them to Loki with the site’s labels. You read them in the service panel, the CLI, the API or Grafana. Logs need the observability stack.
What is collected
Section titled “What is collected”| Source | Collected from | Notes |
|---|---|---|
| Laravel / Statamic | shared/storage/logs/*.log |
Multi-line records (stack traces) are merged into one entry |
| Symfony | shared/var/log |
|
| Other PHP apps | the site’s shared log directory | |
| Web processes, workers, daemons, Horizon, Octane | program output (/var/log/falak) |
|
| Cron jobs and the scheduler | job output | |
| Compose containers | container logs, labelled with the Compose service | |
| Edge requests | /var/log/falak/access/<site>.log |
Shown as Network logs, falak_log_kind="access" |
| Deployments | lifecycle events from the control plane and agents |
Multi-line Laravel records start with [YYYY-MM-DD HH:MM:SS; continuation lines are merged until the next record (capped at 256 KiB per record).
Read logs
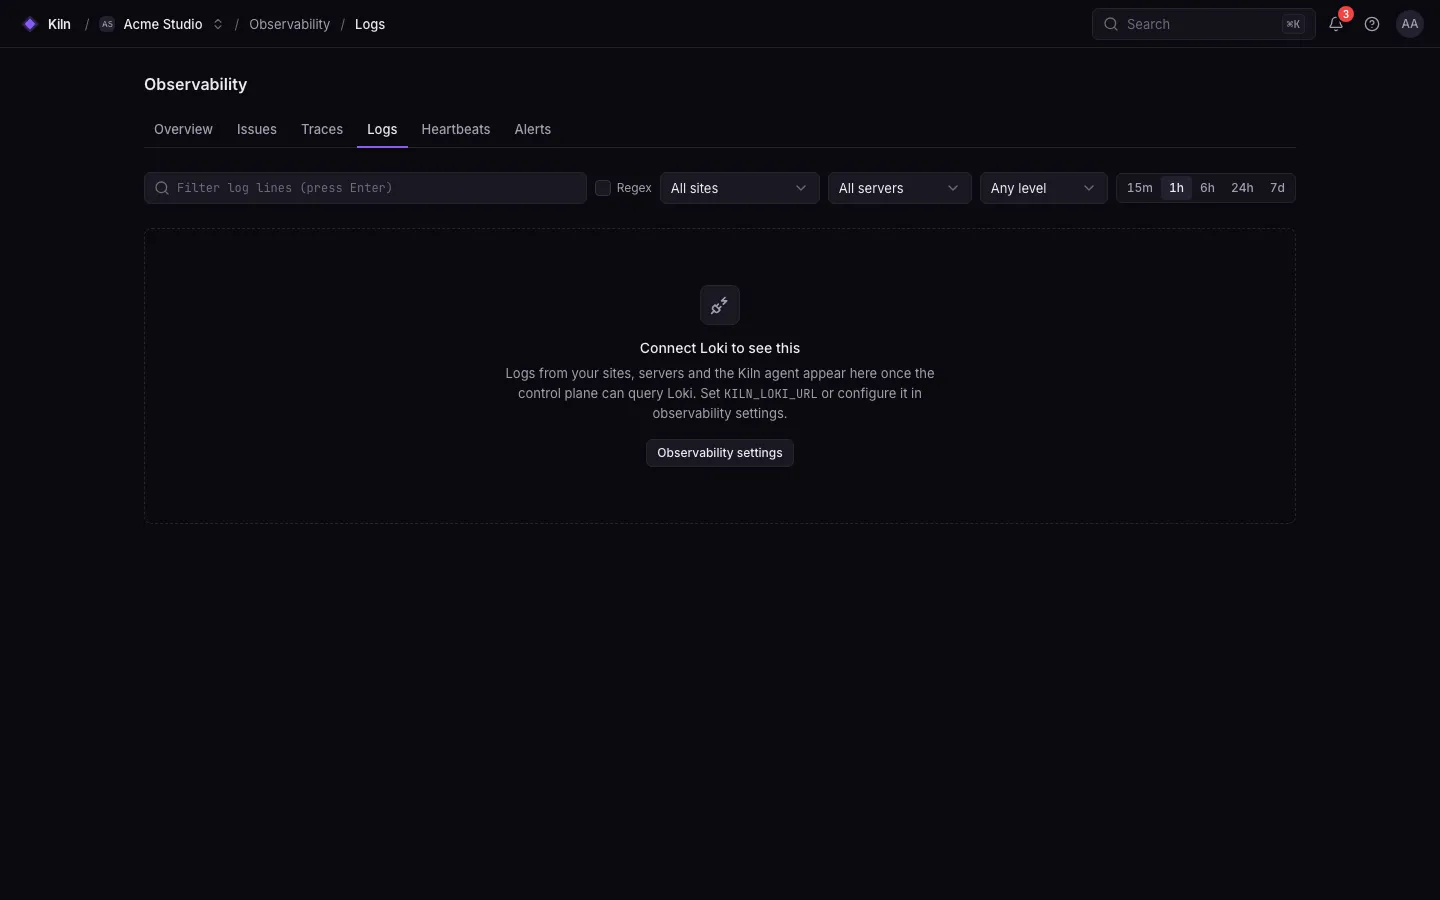
Section titled “Read logs”Service panel → Logs: live stream with search, level and server filters, pause/follow. Click a line to open its trace. Observability → Logs searches across sites.
falak logs shop # last hour, up to 200 linesfalak logs shop --since 6h --level errorfalak logs shop -f # follow, polls every 2 sfalak --json logs shop -f | jq .message # NDJSONcurl "https://falak.example.com/api/v1/sites/shop/logs?since=3600&limit=100&level=error&kind=app" \ -H "Authorization: Bearer $FALAK_TOKEN" -H "Accept: application/json"{"data": [{"at": "2026-09-26T10:00:02.000000+00:00", "level": "ERROR", "source": "laravel", "server": "web-1", "message": "boom", "attributes": {"service_name": "laravel"}}], "meta": {"cursor": "1790000000000000001"}}See Logs API.
Filters
Section titled “Filters”| Filter | Values |
|---|---|
since |
Seconds back (API, default 3600, up to 30 days) or a duration (CLI, 30m, 6h) |
level |
trace, debug, info, warn, error, fatal |
kind |
app (files, programs, cron, containers) or access (edge requests); default both |
limit |
1–1000 per page (API), default 100; CLI default 200 |
cursor |
Continue from the previous page |
In Grafana
Section titled “In Grafana”{service_name="shop", falak_log_kind="app"} |= "SQLSTATE"{service_name="shop", falak_log_kind="access"} | json | status >= 500sum by (falak_server_id) (count_over_time({service_name="shop"} |= "ERROR" [5m]))Troubleshooting
Section titled “Troubleshooting”| Symptom | Fix |
|---|---|
Logs tab empty, API 503 |
The observability stack is not enabled or Loki is down (falak-ctl status). |
| Web request logs missing for a Laravel site | LOG_CHANNEL is stderr; set daily and redeploy. |
Permission denied on laravel.log |
Deploy again; writable directories get group-writable default ACLs so FrankenPHP and workers can share the file. |
Next steps
Section titled “Next steps”Network logsEvery HTTP request the edge served.
TracesInstrument your app with APM.