Observability overview
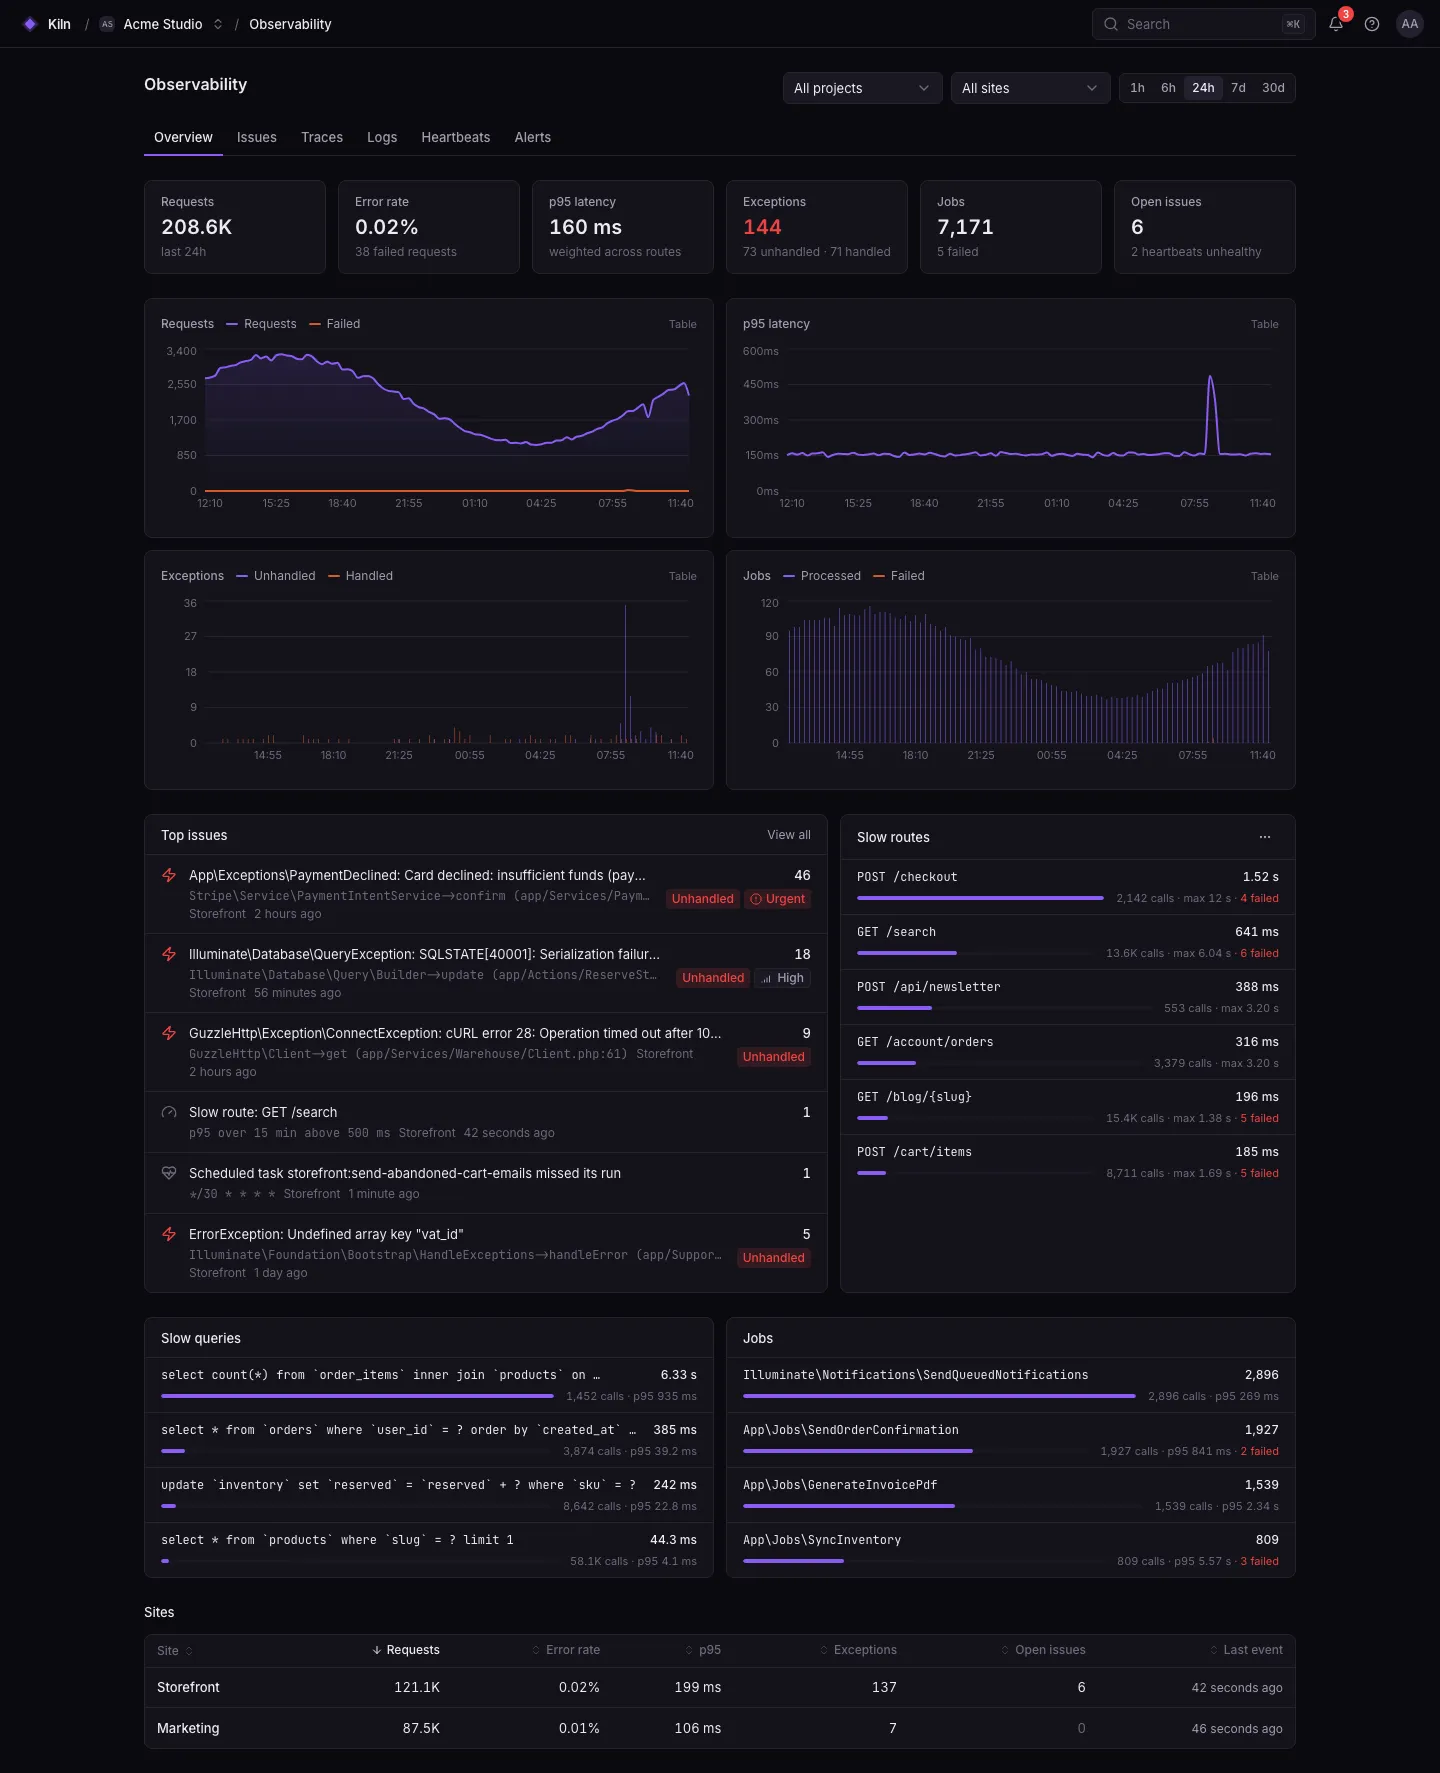
Falak ships an observability stack built on OpenTelemetry, Loki, Tempo, VictoriaMetrics and Grafana, plus Insights, a Nightwatch-style view of your app’s issues and performance. The agent on each server collects and forwards everything; you do not install Promtail, node_exporter or an OpenTelemetry Collector.
What you get
Section titled “What you get”| Signal | Source | Where it goes | Where you see it |
|---|---|---|---|
| Application logs | storage/logs/*.log, Symfony var/log, supervised programs, cron, containers |
Loki | Service panel → Logs; Observability → Logs; falak logs |
| Access logs | Caddy on each server / load balancer | Loki | Deployment panel → Network Logs; access-logs API |
| Host metrics | /proc on each server |
VictoriaMetrics | Server → Metrics; Grafana “Server” dashboard |
| Container metrics | docker stats for Compose sites |
VictoriaMetrics | Grafana “Containers” dashboard |
| Traces | falak/apm-laravel, @falak/apm-node, any OTLP SDK |
Tempo | Observability → Traces; Grafana |
| Exceptions, slow routes, missed cron | APM packages and cron heartbeats | Control plane (Insights) | Observability → Issues / Heartbeats; service panel → Observability |
| Deployment events | Control plane and agents | Loki + Grafana annotations | Grafana “Deployments” dashboard |
Enable the stack
Section titled “Enable the stack”Without --observability, Falak has no log, trace or metrics backend: the Logs, Network Logs, Metrics and Traces views stay empty and the logs API answers 503. Insights (issues, heartbeats) and alerts are part of the control plane itself. Enable the full stack with the installer:
-
Add a DNS record
grafana.falak.example.compointing at the control plane host. -
Re-run the installer with
--observability:Terminal window curl -fsSL https://falak.sh/install.sh \| sudo bash -s -- --domain falak.example.com --email you@example.com --observability -
The installer starts
gateway,loki,tempo,victoriametricsandgrafana, creates a Grafana service account token for Falak (FALAK_GRAFANA_TOKEN), and setsFALAK_OTLP_ENDPOINT=https://falak.example.com/otlp. -
Agents are reconfigured with the OTLP endpoint and start sending telemetry.
Plan for 8 GB RAM on the control plane host with observability. You can also run the stack on another host and point Falak at it with the FALAK_LOKI_URL, FALAK_TEMPO_URL, FALAK_METRICS_QUERY_URL and FALAK_OTLP_ENDPOINT settings.
How data flows
Section titled “How data flows”your app ──(APM package)──► unix:/run/falak/otlp.sock or http://127.0.0.1:4318host metrics · log files · journald · container logs ─► falak-agent (batch, retry, disk buffer)falak-agent ──OTLP/HTTP + token──► https://<panel>/otlp ──► gateway ──► Loki · Tempo · VictoriaMetricsfalak-agent ──exceptions, threshold breaches, cron heartbeats──► control plane (Insights)Telemetry does not pass through the control plane’s database. Only Insights-relevant summaries do.
Labels
Section titled “Labels”Every record from a site carries:
| Label / attribute | Value |
|---|---|
service_name |
The site slug |
falak_site_id, falak_server_id |
Upper-case ids |
falak_log_kind |
app or access |
falak_deployment_id, falak_release_id |
The live release (structured metadata) |
falak_compose_service |
Compose service name (Compose sites) |
Use them to filter in Grafana, for example {service_name="shop", falak_log_kind="app"}.
Retention
Section titled “Retention”| Store | Default | Variable (control plane .env) |
|---|---|---|
| Loki (logs) | 360 h (15 days) | FALAK_LOGS_RETENTION |
| Tempo (traces) | 360 h | FALAK_TRACES_RETENTION |
| VictoriaMetrics | 30 days | FALAK_METRICS_RETENTION |
| Insights occurrences and aggregates | 30 days (issues themselves are kept) | FALAK_INSIGHTS_RETENTION_DAYS |
| Alert history | 90 days | FALAK_ALERTING_RETENTION_DAYS |
Organization settings
Section titled “Organization settings”Settings → Observability (telemetry.manage, admins) lets each organization override:
| Setting | Default |
|---|---|
| OTLP endpoint and token | The server-wide FALAK_OTLP_ENDPOINT / FALAK_OTLP_TOKEN |
| Environment name | production (FALAK_TELEMETRY_ENVIRONMENT) |
| Trace sampling ratio | 1.0 (FALAK_TRACES_SAMPLE_RATIO) |
| Metrics interval | 15 s |
Saving reconfigures every server of the organization.